Start.io audiences
Users Spending Between 25-30 Percent of Income on Rent
in Los Angeles
overview
Users whose rent is 25-30% of their income share some characteristics. The top mobile device for Users Spending Between 25-30 Percent of Income on Rent in Los Angeles is . More interesting statistics about this segment can be found in the charts below.
Country
United States
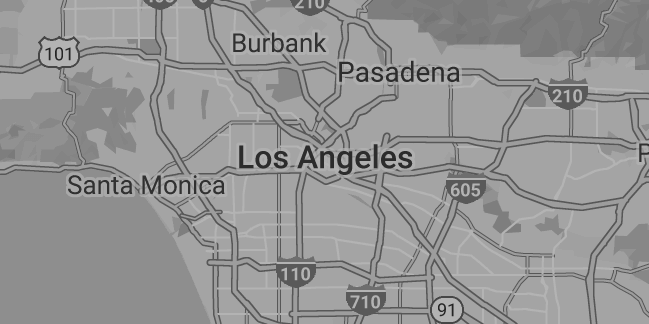
City
Los Angeles, California
Population
3,979,576
Area
468 sq mi
INSIGHTS ON Users Spending Between 25-30 Percent of Income on Rent in Los Angeles
Age
55 years and above 7.9%
45-54 years 6.9%
35-44 years 14.4%
25-34 years 32.3%
18-24 years 38.6%
Gender
Male (56.7%)
Female (43.3%)
Household income
Less than $25,000 25.5%
$25,000 to $39,999 9.5%
$40,000 to $59,999 34.3%
$60,000 to $74,999 9.1%
$75,000 to $99,999 9.7%
$100,000 to $149,999 11.9%
$150,000 and above %
OS
Android (78.3%)
iOS (21.7%)
Leading carriers
01 T-Mobile
02 Verizon
03 T-Mobile
5 most visited places/venues
01 Julian C Dixon Park
02 Algin Sutton Recreation Center
03 Queen Anne Recreation Center
04 City Terrace Park
05 Crenshaw Plaza
Updated: 03-2023